
Our reviewers evaluate software independently. Learn how we stay transparent, our methodology, and tell us about anything we missed.
Our reviewers evaluate software independently. Learn how we stay transparent, our methodology, and tell us about anything we missed.
HR KPIs (key performance indicators) are quantifiable metrics that measure the effectiveness of an organization’s human resources function. They track everything from how quickly you hire to how long employees stay, and they give HR teams the data they need to make strategic workforce decisions rather than relying on gut instinct.
For the first few years of building companies, I didn’t track HR metrics at all. I hired people, managed them as best I could, and dealt with problems as they came up. When someone quit, I’d scramble to replace them. When engagement felt low, I’d throw a team event at it. I had no data, no baselines, and no way to know whether anything I did worked.
That changed when I started working with HR professionals who showed me how a handful of well-chosen KPIs could transform how you manage people. Not 50 metrics on a bloated dashboard that nobody looks at. More like 10 or 12 that moved the needle and connected to real business outcomes. This article covers the HR KPIs I’ve personally found most valuable, organized by category, with honest commentary on which ones matter most and which ones are just noise.
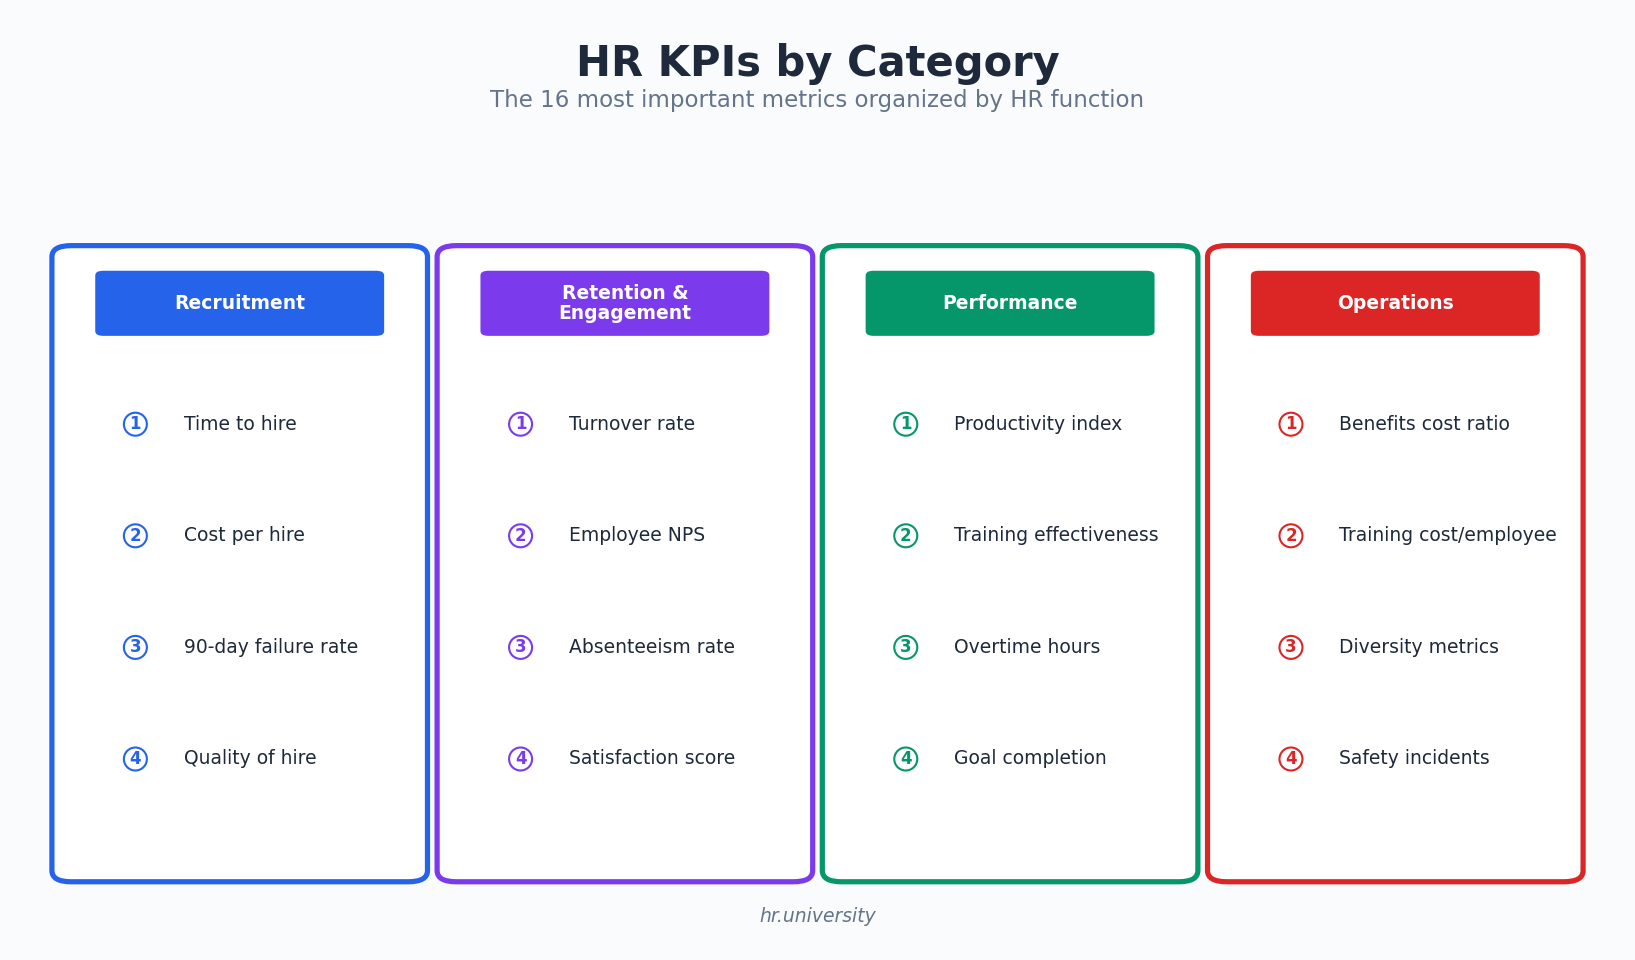
HR KPIs fall into several categories: recruitment, retention and engagement, performance and development, and operational efficiency. The mistake I see most companies make is trying to track everything at once instead of focusing on the metrics that align with their current business priorities and stage of growth.
If you’re growing fast, recruitment KPIs should be your primary focus. If you’re dealing with high turnover, retention metrics are where you should spend your analytical energy. The best approach is to pick 8 to 12 KPIs that directly connect to your top talent management goals and track those consistently before expanding to a broader dashboard.
If I could only track one HR KPI for the rest of my career, it would be retention rate. It’s the single best indicator of whether your organization is a place people want to stay. A high retention rate means you’re doing something right with compensation, culture, growth opportunities, and management quality. A declining retention rate is an early warning signal that something fundamental is broken.
I calculate retention rate as the number of employees who stayed through a period divided by the number at the start of that period, expressed as a percentage. Tracking this monthly and quarterly gives you trend data that’s far more useful than an annual snapshot. Annual retention numbers hide seasonal patterns and delayed effects of changes you’ve made.
What makes retention especially powerful as a KPI is that it’s an outcome metric. It reflects the cumulative effect of everything else you’re doing in HR, from employee onboarding to performance management to compensation strategy. When retention starts dropping, it tells you to dig deeper into the other metrics to find the root cause rather than guessing at solutions.
Employee satisfaction indicates how content people are with their current situation: their pay, benefits, work conditions, management, and sense of purpose. Most of the time, employees don’t leave because of salary alone. They leave because they don’t feel valued, they don’t see a future at the company, or their relationship with their manager has deteriorated. Satisfaction surveys help you catch those feelings before they turn into resignation letters.
I’ve used short pulse surveys (5 to 10 questions, quarterly) rather than lengthy annual engagement surveys. Annual surveys produce stale data because employees can’t accurately remember how they felt nine months ago. Quarterly pulses give you timely, actionable insights. Questions should focus on the company’s work culture, satisfaction with their role, whether they feel respected, and whether they see growth opportunities.
Tools like Qualtrics, SurveyMonkey, or even Google Forms work for collecting this data. What matters more than the tool is what you do with the results. If you survey your team and then nothing changes, you’ll get lower response rates and less honest answers next time. Every survey should lead to at least one visible action that shows employees their feedback was heard.
Time to hire measures the number of days between posting a job and having an accepted offer. In my companies, I’ve seen this range from 14 days for junior roles to over 60 days for specialized technical positions. The goal isn’t necessarily to minimize it at all costs, because rushing hires leads to bad fits, but to benchmark it and identify where bottlenecks exist in your pipeline.
If your time to hire is consistently above your industry average, it usually means one of three things: your job descriptions aren’t attracting the right candidates, your interview process has too many stages, or your offer approval process is too slow. I once cut our average time to hire from 45 days to 28 days just by removing one unnecessary interview round and giving hiring managers pre-approved salary bands so they didn’t need to wait for executive sign-off on every offer.
This metric pairs well with quality of hire and 90-day failure rate. Fast hiring that leads to bad hires isn’t efficient; it’s expensive. I always track time to hire alongside these quality measures to make sure speed isn’t coming at the cost of fit. For teams managing the complete full life cycle recruiting process, this KPI is critical for identifying which stages of the pipeline cause the most delays.
Cost per hire includes everything you spend to fill a position: job advertising, recruiter fees, hiring manager interview time, background checks, assessments, and onboarding costs. The industry average varies widely by role and market, but knowing your specific number gives you a baseline for evaluating whether your recruitment process is efficient and where money is being wasted.
At my companies, I’ve found that employee referrals consistently produce the lowest cost per hire and the highest quality candidates. A referral bonus of $1,000 to $2,000 is a fraction of what you’d spend on external recruiters or extensive job board advertising. Building referral programs into your recruitment strategy is one of the highest-ROI moves you can make.
I also track the 90-day failure rate alongside cost per hire. The 90-day failure rate is the percentage of new hires who leave within their first three months, either voluntarily or because they weren’t a good fit. If your 90-day failure rate is above 10 percent, your hiring process has a structural problem. Every failed hire costs roughly 50 to 200 percent of that position’s annual salary when you factor in recruiting, onboarding, lost productivity, and the cost of rehiring.
Absenteeism rate tracks unplanned absences as a percentage of total scheduled work days. A rising absenteeism rate often signals burnout, low morale, health issues, or disengagement that isn’t being addressed through other channels. It’s a leading indicator, meaning it often spikes before turnover does, which makes it especially valuable for catching problems early enough to fix them.
I’ve seen absenteeism patterns that were clearly linked to specific management issues. In one case, a particular team’s absenteeism rate was double the company average, and when we dug into it, the common factor was a manager who was creating a hostile environment through micromanagement and public criticism. The absenteeism data gave us the signal; the investigation revealed the cause.
The formula is straightforward: total unplanned absence days divided by total available work days, multiplied by 100. Most healthy organizations run between 1.5 and 3 percent. Anything consistently above 4 percent deserves investigation. Tracking this alongside employee experience survey data gives you a more complete picture of workforce wellbeing than either metric alone.
Turnover rate is retention’s counterpart. It measures the percentage of employees who leave during a given period. But the raw number is less useful than the breakdown. I always separate voluntary turnover (people who choose to leave) from involuntary turnover (terminations and layoffs) because they tell completely different stories and require completely different responses.
High voluntary turnover is a red flag that usually points to problems with compensation, career development, management quality, or culture. High involuntary turnover might mean your hiring process needs work, or that your performance management system isn’t catching issues early enough. If you’re frequently terminating people within their first year, the issue is probably poor candidate selection or inadequate onboarding, not the employees themselves.
I also strongly recommend tracking turnover by department and by manager. In my experience, turnover clusters around specific managers far more often than it spreads evenly across the organization. That’s uncomfortable data to surface, but it’s incredibly actionable. When you can show that one manager’s team has 3x the turnover of comparable teams, you’ve identified a coaching opportunity or a personnel decision that needs to be made. Conducting regular stay interviews helps you catch the reasons people are considering leaving before they hand in their notice.
Employee productivity is one of the trickiest HR KPIs because it means different things in different contexts. For sales teams, it might be revenue per employee. For customer support, it could be tickets resolved per hour. For engineering, it might be features shipped per sprint. The key is defining productivity in terms of meaningful output rather than hours worked.
I’ve always been uncomfortable with activity-based productivity metrics, like keystrokes per hour or time spent at a desk, because they measure presence rather than impact. The most productive people I’ve worked with often look “less busy” than their peers because they work efficiently. Measuring output and outcomes, not activity, is the only honest way to assess productivity.
Revenue per employee is one macro-level productivity metric I do find useful. It gives you a high-level sense of whether your workforce is scaling efficiently. If revenue grows 30 percent but headcount grows 50 percent, your per-employee productivity is declining, and that’s a conversation worth having with leadership about where the inefficiencies are.
Training investment is only valuable if it produces measurable results. I track two metrics here: training effectiveness (measured by pre- and post-training assessments plus on-the-job performance changes) and training cost per employee (total training spend divided by headcount). Together, they tell you whether your L&D budget is actually developing people or just burning money.
At one of my companies, we were spending around $2,000 per employee annually on training programs, but when I dug into the data, only about 40 percent of participants showed measurable improvement in the skills the training was supposed to develop. That’s a bad return by any standard.
The fix was getting more targeted. Instead of broad training programs, we used our skills matrix to identify specific gaps and invested in focused training for those areas. Cost per employee dropped, effectiveness went up, and the team valued the training because it was directly relevant to their development goals rather than being generic professional development.
Employee satisfaction and engagement are related but importantly different metrics. Satisfaction measures how content people are with their current situation. Engagement measures how emotionally invested they are in the organization’s success. You can have satisfied employees who aren’t engaged, and that’s a problem because they’re comfortable but not contributing at their full potential.
The Employee Net Promoter Score (eNPS) is a specific engagement metric that I’ve found particularly useful because of its simplicity. It asks one question: on a scale of 0 to 10, how likely are you to recommend this company as a place to work? Scores of 9 or 10 are promoters, 7 or 8 are passives, and 0 to 6 are detractors. Subtract the detractor percentage from the promoter percentage and you have your eNPS. Anything above 20 is generally good.
Tracking employee engagement on a quarterly basis through pulse surveys and eNPS gives you trend data that’s actionable. If engagement drops after a reorganization, you know the change wasn’t communicated or implemented well. If it rises after you launch a new benefits package, you’ve validated the investment. The connection between engagement data and business outcomes is what makes these metrics worth tracking.
Overtime hours are a metric that gets overlooked until it becomes a crisis. Some overtime is normal, especially during product launches or seasonal peaks. But chronic overtime means you’re either understaffed, inefficient, or asking too much of the people you have. In my experience, teams averaging more than 10 percent overtime consistently start showing higher absenteeism and lower engagement within a few months. The two metrics are causally connected.
Benefits administration KPIs track how effectively you’re managing employee benefits, including enrollment rates, benefits utilization, and cost per employee. If you’re offering a benefits package that employees don’t use, you’re spending money that isn’t creating value. High benefits utilization usually correlates with higher satisfaction, so tracking this helps you optimize your benefits investment.
I look at both of these metrics monthly and flag any trends that are moving in the wrong direction. A sudden spike in overtime often precedes turnover in that department by 2 to 3 months, which gives you a window to intervene before you start losing people.
Diversity metrics track the composition of your workforce across dimensions like gender, ethnicity, age, and disability status. They also include hiring rates, promotion rates, and pay equity analysis by demographic group, which reveals whether your processes are genuinely equitable or whether certain groups face systemic barriers that you may not be aware of.
Workplace safety KPIs, such as incident rates, days lost to workplace injuries, and near-miss reports, are especially critical in industries with physical work environments. But even in tech and office-based companies, tracking metrics related to ergonomic complaints, mental health days, and workplace employee performance metrics related to wellbeing gives you useful data on workforce health that pure productivity metrics miss.
These might feel like “nice to have” metrics compared to retention and recruitment KPIs, but they’re increasingly important for employer branding, regulatory compliance, and creating a workplace where diverse talent wants to stay long-term. Companies that ignore these metrics often find themselves reacting to problems they could have prevented.
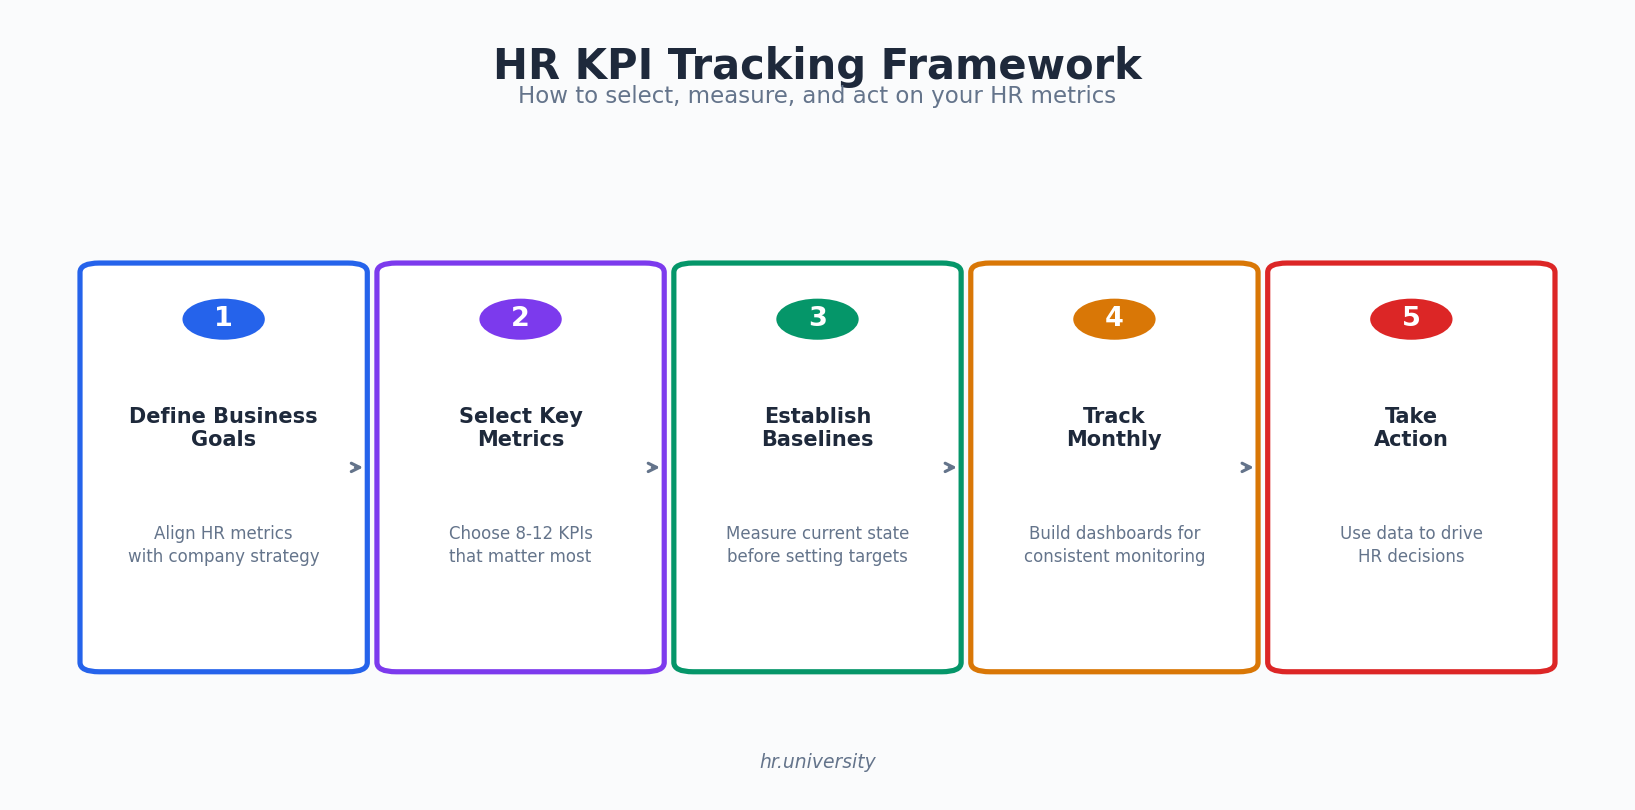
HR KPIs only matter if you actually use them to make decisions. I’ve seen companies build beautiful dashboards packed with 30 metrics that nobody looks at after the first week. That’s a waste of everyone’s time and creates the illusion of being data-driven without any of the substance.
My advice is to start with the metrics that connect most directly to your current business challenges. If retention is your problem, focus there. If you’re scaling fast and need to hire better and faster, prioritize recruitment metrics. Build a simple tracking system, review it monthly with your leadership team, and commit to taking at least one concrete action per quarter based on what the data tells you. That’s how HR KPIs go from interesting numbers on a screen to genuine business drivers that shape how you build and manage your team.
Here I answer the most frequently asked questions about HR KPIs.
In my experience, the five most impactful are employee retention rate, time to hire, employee turnover rate (broken down by voluntary and involuntary), employee engagement score, and 90-day failure rate. These five cover the full employee lifecycle and give you enough data to identify where your biggest HR challenges are without overwhelming you with metrics.
Monthly reviews of your core metrics are ideal, with a deeper quarterly analysis that includes trend comparisons, benchmark comparisons, and action planning. Annual reviews are too infrequent to catch problems in time. I set up monthly automated reports that flag any KPIs that moved more than 10 percent from the previous period so we can investigate early.
It varies by industry, but generally an annual retention rate above 85 percent is considered healthy. Tech companies often aim for 80 to 90 percent, while industries with seasonal workforces may have lower benchmarks. The most important thing is understanding your own trend line and whether it’s improving over time rather than comparing yourself to generic industry benchmarks.
Divide the number of employees who left during a period by the average number of employees during that period, then multiply by 100. For example, if 5 employees left during a quarter and your average headcount was 50, your quarterly turnover rate is 10 percent. Always separate voluntary and involuntary turnover for better insights, because the causes and responses are completely different.
For small teams, Google Sheets or Excel with simple formulas and charts works fine. For mid-size companies, HRIS platforms like BambooHR, Gusto, or Rippling have built-in analytics and reporting. Enterprise organizations often use dedicated people analytics platforms like Visier or connect Tableau to their HRIS data for advanced visualization. The tool matters less than the discipline of tracking consistently and acting on what you find.
All KPIs are metrics, but not all metrics are KPIs. Metrics are any data points you measure about your workforce. KPIs are the specific metrics that are tied directly to strategic business objectives and have defined targets. Tracking the number of resumes received is a metric. Tracking time to hire against a target of 30 days as part of a hiring efficiency goal is a KPI. The difference is the strategic connection and the accountability that comes with it.
Get the weekly newsletter keeping 30,000+ HR pros in the loop.
Learn HR metrics and advance your career.


Get our #1 industry rated weekly technical writing reads newsletter.
Your syllabus has been sent to your email